Ministers over-estimate economic inactivity, ONS data suggests
Government claims that the UK has a growing problem of economic inactivity among the population do not stack up, analysis of data from the Office for National Statistics (ONS) suggests.
In recent months, ministers have criticised what they say is a ‘golf course’ culture, with older people, they say, unwilling to work.
But new analysis suggests that when comparing ‘like for like’ in terms of the point in the year being looked at, economic inactivity is lower than in almost any time since 1997.
“Business cannot get the staff they need” is the regular call from employers. Ministers are heard to blame that on the number of inactive people in the economy.
In his Bloomberg speech in January, Chancellor Jeremy Hunt said there were 5 million people listed as economically inactive but don’t want to work. He said we won’t “fix our productivity puzzle unless everyone who can participate does”.
Home Secretary, Suella Braverman, in her speech at last week’s right wing American sponsored National Conservatives Conference, said that the UK must not “forget how to do things for ourselves”.
She went on to say: “There is no good reason why we can’t train up enough HGV drivers, butchers or fruit pickers.”
‘Not like with like’
Political activist John Holland says: “Here we have our finance minister looking to point the finger of blame at the economically inactive as part of the reason for our poor economic performance whereas Ms. Braverman looks to blame a lack of skills among those not in work for the high levels of migration.”
Much is being made of the growth of the size of the economically inactive population, figures on which were released last week by the Office of National Statistics (ONS).
These figures measure the levels of economic inactivity for time periods up to the end of the first quarter of this year, which showed 21% of those aged from 16 to 64 were economically inactive. This was a reduction of 0.2% compared to the previous quarter, which Jeremy Hunt claimed as good news.
One problem with this statement is that Mr Hunt may not be comparing like with like. There is a regular pattern that can be seen each year between each quarter. This suggests that to be meaningful, any comparison should be between the same quarters in other years.
Figure 1 illustrates this pattern with Q3 and Q4 figures consistently being noticeably lower than Q1 and 2.
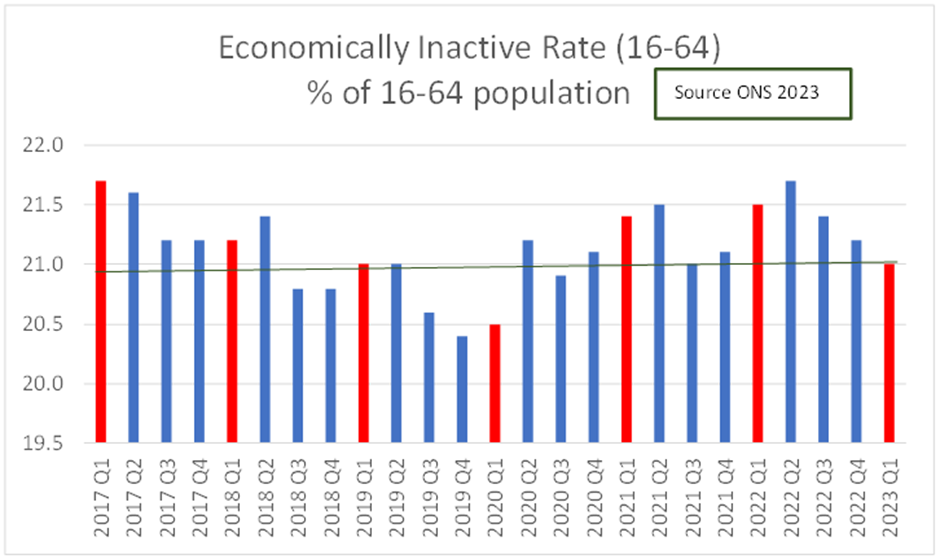
What is also noticeable from Figure 1 is that the claim that the ministers are trying to put forward (that a greater proportion of the population is economically inactive and blaming them for our poor economic performance) might not stand up. Q1s have been highlighted in red. Apart from 2020, in the middle of Covid, the economically inactive part of the population was higher than in 2023.
Political activist John Holland, when shown these figures, said: “This doesn’t surprise me. This Governement will try and blame anyone apart from themselves. It looks like yet another attempt to stoke a culture war with the economically inactive now being the target”.
Our analysis of the figures stands up over the longer term. The first quarter of 2023 had an inactivity rate for under 65s of 21%. The average for the first quarter inactivity for all years since 1997 is 22.8%, so we do not have a greater inactivity problem now than we had in the past.
The ONS figures tell us something about who these people are.
| Status | No. economically Inactive 16 to 64 | % of 16 to 64 population |
| Student | 2,178,653 | 5.1% |
| Looking after family/home | 1,660,093 | 3.9% |
| Temporary Sick | 194,438 | 0.5% |
| Long-term Sick | 2,550,229 | 5.9% |
| Discouraged workers | 30,796 | 0.1% |
| Retired | 1,083,353 | 2.5% |
| Others | 1,032,794 | 2.4% |
| Total | 8,730,355 | 20.3% |
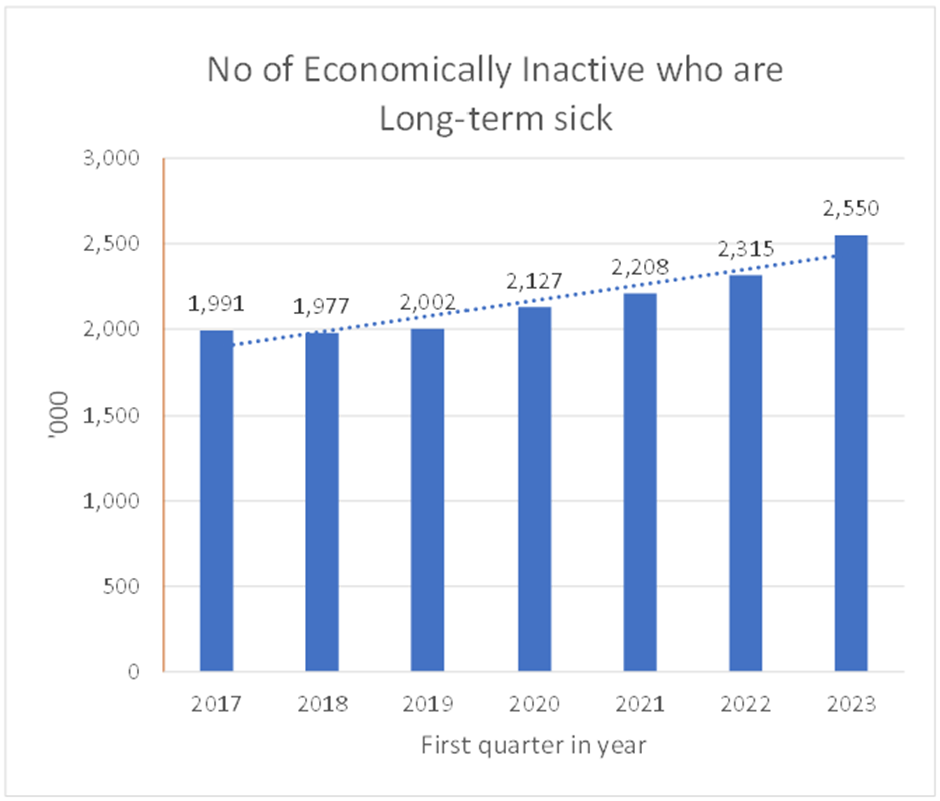
What is apparent from these figures and has received a lot of press comment is the rate of long term sickness in this group which now stands at over 2.5 million, almost 6% of the working age population. As figure 3. shows this growth is ahead of the trend that would normally be expected. There has been speculation that this may be due to a combination of NHS backlogs, long Covid and bad backs from working from home at the kitchen table.
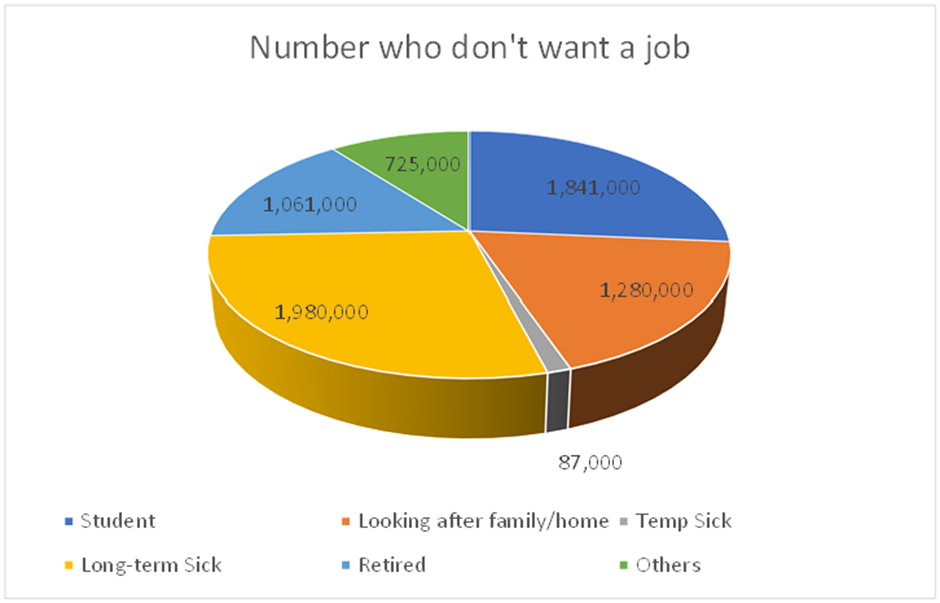
The ONS also tells us that 1.7 million of the economically inactive say they want a job, leaving almost 7 million who are not wanting a job. These are categorised in Figure 4.
Someone is treated as unemployed for ONS’s figures if they are available for work and claiming unemployment benefit. To be treated as economically inactive you need to have not been seeking work in the last four weeks and/or are unable to start for two weeks. To many this may seem just a technicality.
Approximately 1 in 6 students are looking for a job. A quarter of those with caring responsibilities and long term sick say they want a job. Although published unemployment is 3.9% representing 1.7 million people in reality, if those tagged as economically inactive but wanting a job are included the number of people wanting employment doubles to 3.4 million. Government critics suggest that maybe a headline unemployment rate of nearly 8% isn’t so attractive for the Chancellor and his colleagues.
The higher rate of available domestic workforce that these figures suggest give more credibility to Ms Bravemans’ argument against using immigration to solve labour shortages. The size of the caring population that want to work certainly backs the wider support for childcare in the last budget. Many commentators have recognised that the strongest message is the growing level of long-term sickness which shouts out for the urgent need to mend the NHS.